
The revenue operations dashboard metrics executives need are a short set across the full funnel: pipeline created and coverage, stage conversion and velocity, CAC and payback, net new and net retained revenue, and forecast accuracy. Each metric needs one definition, one owner and one decision attached. Everything else is reporting noise.
Finance has dashboards. What finance lacks is a number it can defend. Pipeline sits in the CRM, spend sits in the ad platforms, and cash sits in the ledger. Each system is consistent with itself, but the combined view is not. Strong marketing reporting that ties activity to pipeline starts by fixing that, before anyone picks a chart.
You may already have dashboards, and another one won't help if nobody trusts the numbers. That is fair. The fix is definitions, ownership and tracking foundations first, then the view.
Which dashboard KPIs does an executive need?
Five questions cover what executives ask. Pick two or three metrics per question at most, and drop the rest. These are the dashboard KPIs worth a place on the page:
Order the page by what carries the business. Recurring revenue comes first, and one-off project revenue appears as what it is. A dashboard that blends them hides the answer the board wants.
This is why we treat the dashboard as the output of a revenue system, not a reporting project. RevOps built as client-owned infrastructure puts the CRM architecture, tracking and automation behind each number.
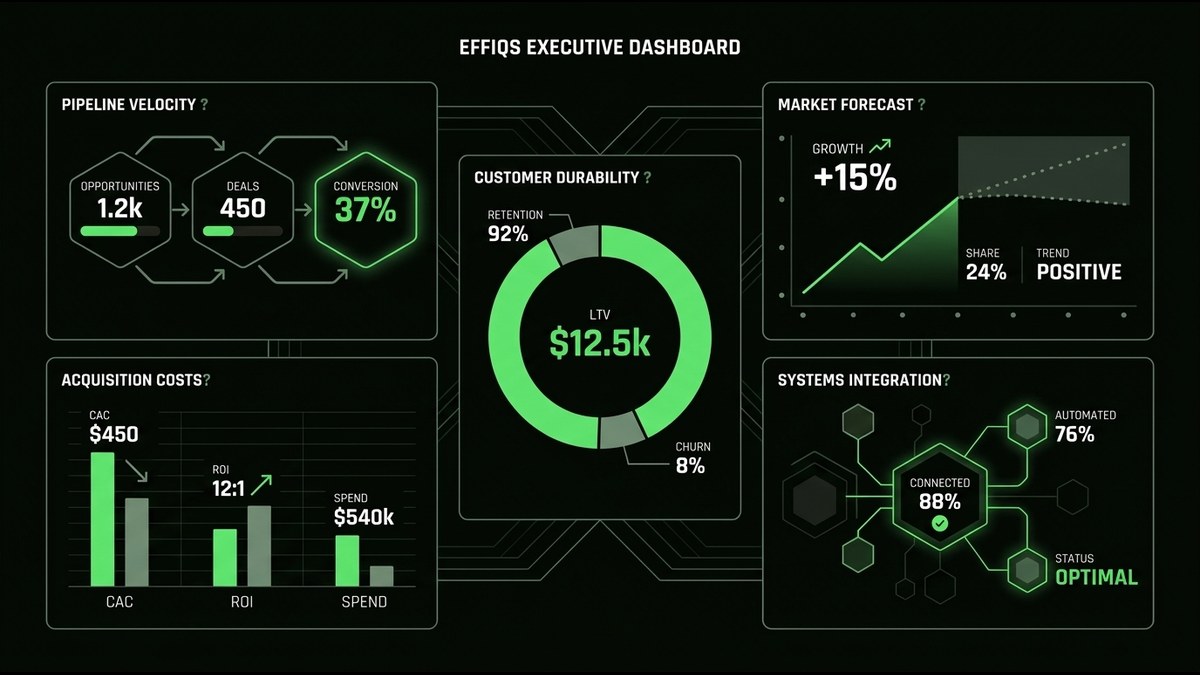
- Is there enough pipeline?. Pipeline created by source and pipeline coverage against target.
- Is it converting, and how fast?. Stage-to-stage conversion and sales velocity.
- What does growth cost?. Blended and channel-level CAC, plus payback period.
- Is revenue durable?. Net new revenue, retention and expansion.
- Can we trust the forecast?. Forecast accuracy over time.
Why do executive dashboards fail early?
They fail on data trust, not on chart design. Stage definitions live in a policy document but not in the CRM. Each team counts differently. Tracking stops at lead creation. When that happens, the report reflects user behavior, not the pipeline that exists. A cleaner chart cannot fix it.
Ownership is the second gap. Sales operations owns process integrity: clean records, enforced stages, honest hygiene. That is not the same as owning what a metric means. Someone has to own each definition, or the argument about "which number is right" repeats every month. Tool sprawl is often an ownership problem in disguise, and a tech stack audit that maps where each metric's data lives shows where definitions split apart.
I come at this from tracking. I have spent four years across PPC, tracking and reporting insights, including campaign tracking foundations and performance analytics at Effiqs. The pattern holds every time: the dashboard is only as honest as the tracking beneath it. That is why Paula's rule is to fix tracking before spend, and spend before executive reporting.
The order of work matters:
- Write one definition per metric.
- Enforce stage criteria inside the CRM, not just in a slide.
- Name one owner per metric.
- Extend tracking past lead creation to pipeline and revenue.
- Only then build the view.
Which pipeline metrics show next quarter's coverage?
Four metrics show whether next quarter's number exists today and where deals stall:
Report them by ICP fit, not just volume. A large pipeline of poor-fit accounts looks healthy and closes badly. Coverage should be judged on the accounts you actually want.
This only works if attribution reaches pipeline. Multi-touch attribution that shows which channels source pipeline closes the blind spot where marketing reports activity and sales reports deals. Without it, "created by source" is a guess.
My view is plain: paid media strategy must focus on tracking, reporting insights, and true buying intent rather than vanity metrics. Impressions and engagement counts do not belong on an executive page. They do not tell you whether next quarter is covered.
- Pipeline created by source.. Where new opportunities come from, counted at the opportunity stage, not the lead stage.
- Pipeline coverage against target.. How much open pipeline you hold relative to the number you owe.
- Stage-to-stage conversion.. Where deals leave the funnel.
- Sales velocity.. How quickly qualified deals move through it.
What does growth cost beyond cost per lead?
Report three things: blended CAC, channel-level CAC, and payback period. Add a pipeline-based view of marketing return, so spend is judged against opportunities and revenue, not form fills.
Cost per lead is the trap. It rewards volume and hides fit. When attribution stops at lead creation, budget drifts toward the cheapest lead instead of the best pipeline. The numbers look efficient while the sales team works poor-fit accounts. This is also where CAC becomes opaque for the board: finance cannot defend a cost that is never connected to revenue.
Follow the full path. In our own operating view, we track a qualified strategy-call booking through to the first project and on to a recurring engagement. Measuring only the first click would tell us nothing about which channel builds revenue. Calculating marketing ROI without fooling yourself goes deeper on that discipline.
A note on benchmarks: we give no ratio targets here. A "healthy" CAC depends on your margin, motion and sales cycle. Set the standard with finance, write it down, and hold the dashboard to it.
Is growth durable and the forecast reliable?
Split net new revenue into new, expansion, contraction and churn. Then add retention and forecast accuracy beside it. Growth that leaks through churn, or a forecast that misses repeatedly, tells the board more than a top-line number does.
A single "revenue grew" line hides the story. New business can mask contraction. Expansion can mask churn. Splitting the movement shows whether the base is strengthening or being replaced. Forecast accuracy, tracked over time instead of once, shows whether the process is learning.
Our own operating cadence is a useful example. We review a short set of revenue KPIs every month: net new recurring revenue, conversion between stages, forecast accuracy, and retention and expansion. Each one has to lead to a strategy adjustment. If a metric changes and nothing else does, it is commentary, not management.
That cadence is also what turns reporting into a system. Growth operations built for predictable revenue rests on the same idea: a structural measure of the business beats a campaign measure every time.
How do you build a five-minute dashboard?
Use one view, one definition per metric, one named owner, and a visual that shows direction against target. Put the decision each metric triggers next to it. If a metric cannot change a decision, remove it.
That is the standard we apply to executive reporting. The goal is what Paula calls "simplifying complex analytics into practical takeaways that drive real business decisions." A reader should see where things stand, whether they are moving the right way, and what to do about it, without a walkthrough.
A workable layout:
For the build, Looker Studio dashboards that unify marketing and pipeline data give you one trusted view across sources. Our Data Studio dashboards service covers connecting that view to CRM and tracking data.
Then keep the monthly review. Every metric either triggers an adjustment or earns its removal. That habit is what keeps a dashboard from becoming wallpaper.
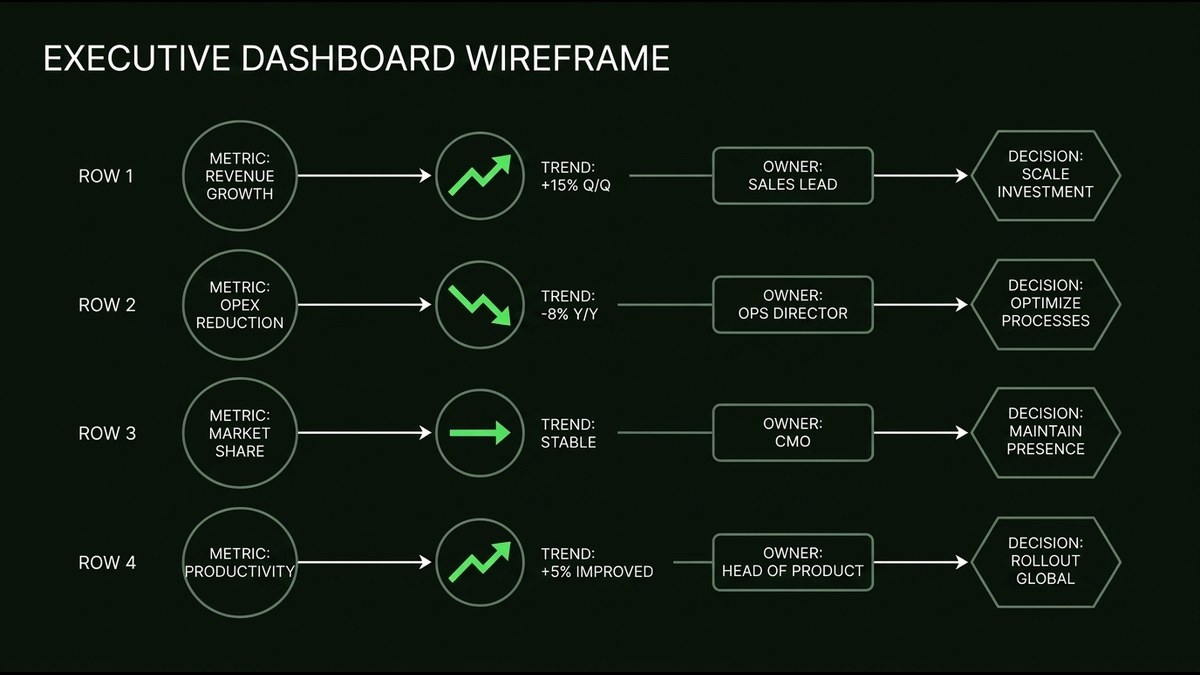
- Top row:. the five groups as single numbers with direction against target.
- Middle:. one trend per group, not ten.
- Right edge:. owner and the next decision for each metric.
- Footer:. definitions, data sources and last refresh time.
What should you check first?
Before you build anything, check which of these five groups you cannot yet defend in front of the board. That gap, not the chart, is your first project. If you want a second pair of eyes on it, talk to effiqs.
- Pipeline created and coverage
- Conversion and velocity
- CAC and payback
- Net new revenue, retention and expansion
- Forecast accuracy
- ✓ Use five questions, two or three metrics each, and nothing that cannot answer one of them.
- ✓ Fix definitions, ownership and tracking first, and the dashboard becomes a reflection instead of an argument.
- ✓ Show pipeline created, coverage, conversion and velocity by ICP fit, each tied to a traceable source.
- ✓ Judge spend against pipeline and payback, not cost per lead, and show movement inside revenue, not just the total.
- ✓ Give every metric one view, one owner and one decision, reviewed every month.
FAQ
What metrics should a revenue operations dashboard include for executives?+
Five groups: pipeline created and coverage, stage conversion and velocity, CAC and payback, net new and net retained revenue, and forecast accuracy. Pick two or three metrics per group at most, and give each one a single definition, owner and decision.
Why do executive revenue dashboards fail?+
They usually fail on data trust, not chart design. Stage definitions are not enforced in the CRM, teams count differently, tracking stops at lead creation, and nobody owns what each metric means.
Why is cost per lead a poor metric for executives?+
Cost per lead rewards volume and hides fit. When attribution stops at lead creation, budget drifts toward the cheapest lead instead of the best pipeline. Blended CAC, channel-level CAC and payback period, judged against pipeline and revenue, give finance a cost it can defend.
How should net new revenue be reported to a board?+
Split it into new, expansion, contraction and churn, and show retention and forecast accuracy beside it. A single growth line can hide contraction behind new business or churn behind expansion.
What makes a dashboard readable in five minutes?+
One view, one definition per metric, one named owner, and a visual showing direction against target, with the decision each metric triggers placed next to it. If a metric cannot change a decision, remove it.