
A RevOps diagnostic audit evaluates the structural health of a revenue engine across six layers: CRM data integrity, attribution and tracking accuracy, sales and marketing alignment, funnel conversion logic, forecasting and reporting infrastructure, and tech-stack integration. The goal is to surface the 3 to 5 failures blocking pipeline predictability and prioritize fixes by revenue impact, not effort.
Your board asks for a forecast and you hedge. Your attribution report contradicts your finance model. Your CRM is a data graveyard nobody trusts. You already know something is structurally broken. The real question is what to fix first, and whether your team can find out without paying a consultant to confirm what you suspect.
This RevOps diagnostic audit checklist gives you six infrastructure layers, 36 audit questions, and a way to rank fixes. It separates revenue-critical failures from cosmetic ones. Run the diagnostic first, then decide where the money goes.
Why Most B2B SaaS Revenue Systems Are Structurally Broken (and How You'd Know)
Your pipeline isn't the problem. Your GTM architecture is. Most B2B SaaS companies in the $5M to $50M ARR range have marketing, sales, and a CRM. What they lack is the connective tissue that turns those parts into a revenue engine. Without it, you get three departments with misaligned incentives and fragmented data.
The CRM is a graveyard of duplicate contacts, unmapped deal stages, and disconnected workflows between marketing and sales. Reports are unreliable and leadership doesn't trust the numbers. Marketing reports MQLs that sales rejects. Sales forecasts opportunities that never existed. Finance asks where the budget went, and attribution offers five different answers.
This isn't a tactical execution problem. It's structural. Systems built on inherited defaults, not on your actual GTM motion, fail the same way at every layer. Standard funnel metrics also break down fast once several stakeholders join the buying process.
If your team can't agree on what is broken, start with problem framing. That is why the diagnostic comes before any tool purchase or rebuild. The point is to get everyone describing the same problem before anyone tries a fix. The most expensive mistake in growth is executing on the wrong system fast.
The RevOps Diagnostic Audit Checklist: Six Infrastructure Layers
Revenue operations isn't a department. It's the architecture that connects marketing, sales, and finance into one accountable system. Teams usually define it as either a person who cleans up the CRM, which is too narrow, or a vague hope for alignment, which is too broad. Neither helps you run a revenue operations assessment.
An infrastructure audit examines six specific layers, and a failure in one cascades into the others. Operations owns process integrity across these layers. Revenue leadership owns the outcomes. Finance owns the numbers that result. The diagnostic tells you which layer is failing and where accountability sits.
- 1. CRM Data Integrity & Hygiene (the foundation). Contact, account, and deal records; field completion; duplicate management; ownership rules.
- 2. Attribution & Conversion Tracking Architecture (the instrumentation). UTM governance, event definitions, analytics-to-CRM sync, multi-touch accuracy.
- 3. Sales & Marketing Alignment (the handoff protocol). MQL definitions, routing SLAs, feedback loops, ownership boundaries by stage.
- 4. Funnel Conversion Logic & Stage Definitions (the pipeline model). Stage-exit criteria, velocity, leakage, conversion thresholds.
- 5. Forecasting, Reporting & Pipeline Visibility (the control panel). Pipeline coverage, forecast accuracy, dashboard adoption, data latency.
- 6. Tech Stack Integration & Automation Workflows (the connective tissue). Sync health, manual handoffs, tool redundancy, automation coverage.
Layer 1: CRM Data Integrity & Hygiene Audit
A CRM nobody trusts is worse than no CRM. Maybe your sales team keeps a side spreadsheet, or your attribution report contradicts deal-source data. The problem isn't user adoption. It's data debt, and every report, forecast, and automation downstream inherits it.
This layer comes first because attribution, forecasting, and pipeline reporting all depend on clean, governed data. Treat hygiene as ongoing operational governance, not a one-time cleanup. Data hygiene is the baseline, and everything else in this checklist assumes the data layer is trustworthy.
- What is your duplicate-contact rate, and do you have automated deduplication rules?. Pull contacts created in the past 90 days and filter for duplicate emails or names. Duplicates fragment attribution, inflate list counts, and corrupt lead scoring.
- Are required fields enforced at deal creation, and is completion tracked by rep?. Check whether deals can be created without source, industry, deal size, or close date. Missing fields break reporting and forecasting. Completion by rep separates training gaps from systemic issues.
- Do you have orphaned records (no owner, or an inactive owner)?. Report on records with a blank owner or a deactivated user. Orphaned records don't get worked, miss automated touches, and skew velocity calculations.
- Is there a documented data-entry standard, and is it enforced?. Look for inconsistent company names, free-text industries instead of picklists, and mixed phone formats. Inconsistent data blocks segmentation and rollups.
- Are deal stages mapped to your real sales process, or are they CRM defaults?. Ask whether each stage reflects a real buying milestone. Generic names like "Qualified" or "Proposal Sent" often don't match how deals progress, and misaligned stages produce inaccurate forecasts.
- Do you track historical data integrity after migrations or bulk imports?. Sample older records for data loss, field-mapping errors, and broken relationships such as contacts detached from accounts or deals missing contacts. Year-over-year analysis depends on it.
- What is your lead-to-contact sync accuracy (marketing records reaching the CRM)?. Compare lead counts in marketing automation to contacts in the CRM. Sync failures and form errors cause real lead loss. Unified dashboards that consolidate pipeline and attribution data expose these gaps before they become forecasting black holes.
Layer 2: Attribution & Conversion Tracking Architecture
Attribution feeds every ROI calculation, channel investment decision, and board-level growth metric. If the tracking is wrong, the strategy is wrong.
Attribution black holes don't announce themselves. Deals close and revenue posts, and nobody notices that half the pipeline shows "Unknown" or "Direct" as first touch. Audit the plumbing.
Attribution infrastructure decides whether marketing answers to pipeline or to vanity metrics. Calculating marketing ROI honestly starts with tracking that connects spend to revenue at the deal level, not the MQL level.
- Do you have UTM governance (documented standards, enforcement, QA)?. Review recent campaign URLs for inconsistent naming (case, underscores vs. hyphens, free-text values). UTM chaos breaks source reporting at scale.
- Are conversion events defined consistently across analytics, CRM, and ad platforms?. Compare how "demo request," "trial signup," and "contact form" are defined in each system. Inconsistent taxonomy causes double-counting and attribution mismatches.
- Is cross-domain and subdomain tracking configured correctly?. If your site, blog, and landing pages sit on different domains, verify that sessions persist across them. Broken tracking credits organic blog traffic as "direct" when users convert elsewhere.
- Are offline conversions (demo bookings, sales-entered opportunities) imported back to ad platforms?. Check whether sales-created deals are pushed back to Google Ads, LinkedIn, or Meta. Without them, paid media optimizes for form fills, not revenue, and over-indexes on low-intent clicks.
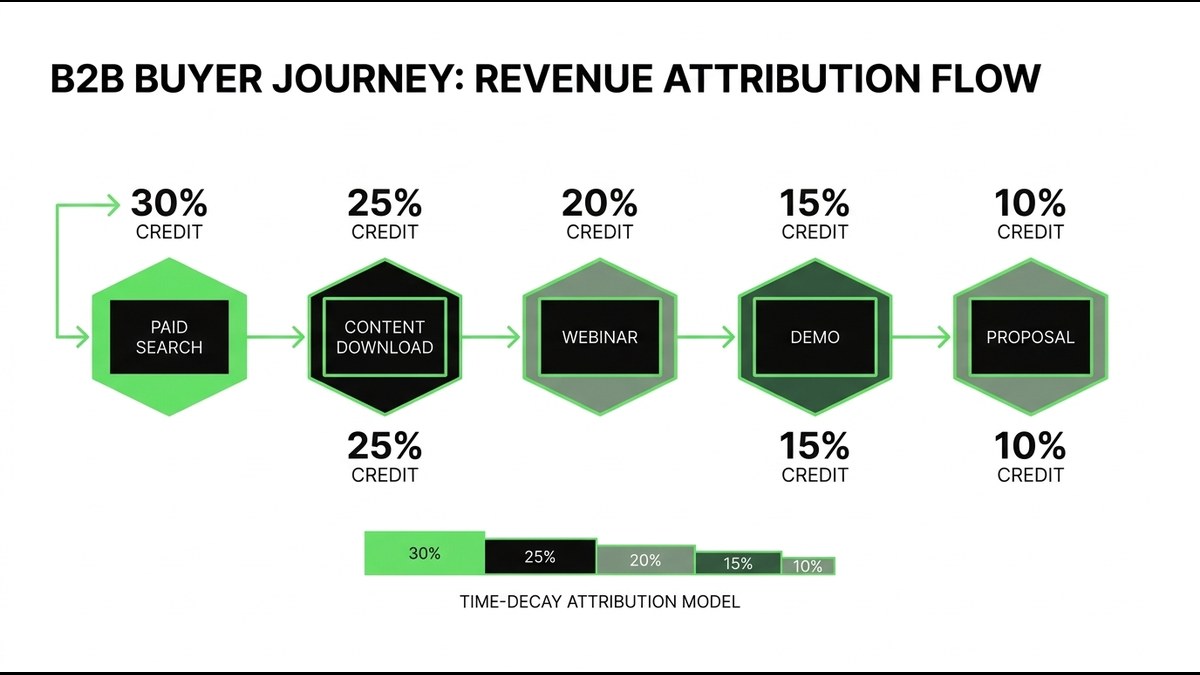
- Does your multi-touch attribution model match your actual customer journey?. Check whether first-touch, last-touch, linear, or time-decay reflects how buyers engage. Gartner's research on the B2B buying journey describes buying groups of 6 to 10 decision-makers, and single-touch models under-credit top-of-funnel brand and content.
- What is your analytics-to-CRM deal-match rate, and where do mismatches occur?. Check how many closed deals have a matching session or user ID. Low match rates point to ad blockers, server-side event failures, or form-submission bugs. Find the failure point: submission, CRM sync, or session stitching.
- Are revenue values and deal timestamps syncing from CRM to analytics?. Verify that deal amount and close date reach your analytics or BI tool in near-real-time, not in an overnight batch. Revenue attribution depends on these fields.
Layer 3: Sales & Marketing Alignment (Handoff, SLA, Ownership)
Structural misalignment lives in the handoff, not the tools. Marketing and sales can share a CRM, attend the same meetings, and report to the same executive, and still run on incompatible definitions of success.
This layer asks one question: is alignment a documented operating agreement, or an aspirational Slack conversation? Alignment isn't cultural, it's operational. Fix the handoff layer first, because every downstream optimization assumes the MQL-to-SQL bridge holds.
- Is the MQL definition documented, agreed by both teams, and enforced in scoring or routing logic?. Compare the written criteria to the actual scoring model or routing rules. If sales rejects a large share of MQLs, the definition is too loose or not enforced in the system.
- Is there a lead-handoff SLA (response time, follow-up cadence), and is compliance tracked?. Check that a documented SLA covers how fast sales contacts new MQLs and how many touches happen before a lead is recycled. Fast response to inbound leads converts at materially higher rates than multi-day delays.
- What is the MQL-to-SQL conversion rate, and does sales log structured feedback on rejected leads?. Calculate the share of MQLs sales accepts. Targets vary by segment, but a persistently low rate signals a broken definition or poor lead quality. Rejection reasons logged in the CRM let marketing adjust targeting.
- Are account ownership rules clear for inbound vs. outbound, new business vs. expansion, and partner-sourced deals?. If an inbound lead arrives from an account an AE already owns, who gets it? If a partner refers a deal, how is attribution split? Ambiguity creates friction and duplicate outreach.
- Is there a formal process for recycling or nurturing leads that aren't sales-ready?. Check whether rejected MQLs return to nurture, go back to SDRs after 90 days, or sit untouched forever. Without recycling, top-of-funnel spend gets no second chance to convert.
- Do sales and marketing hold joint pipeline reviews and share KPIs?. Verify that both functions attend and jointly own pipeline coverage, SQL-to-opportunity conversion, and speed to close. If marketing is measured on MQLs and sales on closed deals, incentives diverge and finger-pointing replaces collaboration.
Layer 4: Funnel Conversion Logic & Stage Definitions
Do you have a funnel or a list of labels? Most B2B SaaS companies inherit stages from CRM defaults and never revisit them. The result is stage names that don't match buying behavior, exit criteria nobody enforces, and conversion thresholds that come from aspiration, not data.
Funnel logic determines whether forecasts are predictive or wishful. Companies with a defined sales motion and clear ownership of revenue targets have the data to build stage-based models. If your stages keep shifting because the target customer is still unsettled, settle product-market fit before you tune the funnel around it. This layer tells you whether the stages themselves are investment-grade.
- Are stage-exit criteria documented and enforced?. For each stage, ask what event or qualification gate triggers advancement. If the answer is "AE discretion" or "when we send a proposal," the funnel is opinion-based. Enforceable criteria tie to buyer actions: demo completed, technical validation passed, budget confirmed.
- Do you track conversion thresholds by stage and benchmark them?. Calculate MQL to SQL, SQL to opportunity, and opportunity to closed-won. Rates vary by segment: enterprise typically converts lower with higher-value deals, and mid-market converts higher with smaller ones.
- What is median time-in-stage for each step, and where do deals stall?. Pull a velocity report. Deals parked in "Proposal Sent" for 45+ days point to objection-handling gaps or pricing friction. Deals that jump from "Discovery" to "Closed-Won" in a week suggest the stages don't reflect the real process.
- Do you run leakage analysis (where deals exit and why)?. Track loss reasons by stage. If many SQLs die on "no budget," qualification is too loose. If late-stage deals keep going to a competitor, revisit differentiation or pricing.
- Are stages consistent across business lines, segments, and regions?. If enterprise uses six stages and SMB uses four, pipeline rollups are meaningless. Standardize stages or segment reporting by motion, and don't mix incompatible funnels in one forecast.
Layer 5: Forecasting, Reporting & Pipeline Visibility
If Layers 1 to 4 are the engine, this is the instrument panel. It answers the question every board asks: can we trust these numbers?
The problem usually isn't sales execution. It's the reporting layer feeding the forecast model. This is also where pipeline volatility gets blamed on reps when the real cause is the plumbing. Reporting integrity decides whether leaders act on current data or last month's snapshot.

- What is your pipeline coverage ratio, and is it tracked by rep, team, and segment?. Divide total pipeline by quota at several levels: company, AE, region, deal size. Strong operations carry more coverage early in the quarter and tighter coverage late. Low coverage means one slipped deal misses the number.
- Is forecast accuracy improving quarter over quarter, and do you run post-mortems on misses?. Track the variance between forecast and actual for four quarters. If accuracy isn't trending up, the model is structurally flawed, whether it is stage-based, rep-submitted, or historical. Post-mortems should show whether misses came from optimistic rep input, stage slippage, or deal-size variance.
- Do decision-makers use the dashboards, or request custom reports every week?. Check login frequency and view counts. If executives ask for one-off reports instead of opening the dashboard, it doesn't answer their questions. Adoption is a proxy for trust.
- What is your data latency?. Verify how often CRM data syncs to your BI tool. Real-time visibility matters in the last two weeks of a quarter, when deal status changes daily. Overnight batches create decision lag.
- Do you have one source of truth, or ten competing spreadsheets?. Count the pipeline reports, forecast models, and attribution dashboards leadership references. If sales uses one view, marketing another, and finance reconciles in Excel, that is reporting chaos, not visibility. Integrating RevOps across the CRM shows the full customer lifecycle, from prospecting to post-sale, and removes the fragmented sources.
Layer 6: Tech Stack Integration & Automation Workflows
Operational waste hides in the connective tissue. You have a CRM, marketing automation, analytics, a sales engagement tool, and a data warehouse. Each works on its own. The question is whether they work together, or whether your RevOps team spends its week copying data between systems and chasing sync failures.
Tech stack governance prevents tool sprawl and fragmented workflows. This layer asks whether your automations match your process, or whether you are bending the process to fit tool defaults. Integration and automation coverage decide whether RevOps is a strategic function or a manual-labor bottleneck. Channel work depends on it too, since a channel platform only proves pipeline impact when it is cleanly connected to your CRM.
- What is your sync failure rate, and are failures monitored proactively?. Pull integration error logs and calculate the share of records that fail to sync. High rates point to misconfigured field mappings, API rate limits, or duplicate rules blocking legitimate records. Check whether failures trigger alerts or sit unnoticed for weeks.
- How many manual handoffs remain?. Map the lead-to-revenue workflow and count human copy-paste steps, such as exporting lists to paid media platforms, copying deal data into finance spreadsheets, and updating lead status after a webinar. Each is a failure point and a time sink.
- Do you have tool overlap?. Look for two analytics platforms, two email tools, or overlapping form builders. Overlap fragments data, inflates license costs, and creates competing versions of the truth. Consolidate or assign clear boundaries.
- What share of repeatable tasks has no workflow automation?. Review lead assignment, stage updates, meeting reminders, and post-demo follow-ups. Manual execution of repeatable tasks doesn't scale and introduces error.
- Are integrations native or duct-taped?. Classify each connection. Native integrations are vendor-supported and update automatically. Middleware and custom scripts need maintenance and break when APIs change. Prioritize native connections for mission-critical data flows.
- Do you track workflow performance (completion rate, error rate, execution time)?. If a workflow is meant to assign leads within a target window and you don't measure whether it hits that window, you can't tell when it degrades. Observability matters as much as existence.
How to Prioritize Fixes Once the Diagnostic Is Done
An honest diagnostic surfaces dozens of issues. Fixing them all in parallel creates paralysis and political gridlock. Prioritization is the output of the diagnostic, not a separate project. Four rules separate revenue-critical failures from cosmetic inefficiencies.
- Revenue impact first.. Fixes that affect pipeline accuracy, forecast reliability, or attribution integrity go to the top. A broken MQL definition that inflates pipeline costs more than a manual export that wastes two hours a week. Quantify the loss for each issue and rank by magnitude.
- Foundation before automation.. CRM hygiene and tracking architecture come before workflow builds and dashboards. Automating a broken process locks in the failure at scale. Clean the data, fix the instrumentation, and align handoff definitions. Only then build nurture workflows or predictive models.
- Quick wins for momentum.. Pick one two-week fix, such as realigning the MQL definition, consolidating UTM parameters, or setting a handoff SLA. It proves the diagnostic's value before you tackle three-month overhauls and builds the case for the budget ask.
- Shared ownership.. Process integrity lives with operations, and outcome accountability lives with revenue leadership. A fix marketing can execute alone (UTM standards) moves faster than one needing sales buy-in (redefining stages). Give every issue a single owner and escalate cross-functional dependencies early. A fix without an owner is just a one-off task.
What "Good" Looks Like: The RevOps Maturity Benchmarks
The diagnostic tells you what's broken. Benchmarks tell you what fixed looks like. Without a target state, every improvement is subjective and every fix is debatable. Treat these as the thresholds of a sound revenue engine and as a scoring standard for your audit. Use them as the target state when prioritizing fixes and justifying budget, and hold account-based programs to the same conversion and attribution standards.
- CRM data health. Duplicate rate kept low and monitored. Required fields near-complete for critical data (deal source, industry, close date). Orphaned records minimal in well-governed systems.
- Attribution accuracy. Analytics-to-CRM deal-match rates vary by implementation, but strong systems keep high correlation. UTM compliance is consistent, with minimal "unknown" or "direct" as top sources. Offline-conversion imports arrive within a couple of business days.
- Funnel conversion. MQL-to-SQL varies by segment: enterprise lower, mid-market higher. Later-stage conversion depends on sales motion, deal complexity, and market conditions. Channels such as paid search drive these conversions differently by segment, so channel-level analysis helps isolate where to improve.
- Forecast accuracy. Quarterly variance tightens quarter over quarter. Coverage is higher early in the period and tighter late.
- Lead response. Inbound MQLs are contacted quickly under a documented SLA, with compliance tracked by rep.
- Sales/marketing alignment. A healthy MQL acceptance rate signals definition quality. Joint pipeline reviews happen weekly with both functions present. Shared KPIs live in a single dashboard.
Conclusion: Run the Diagnostic Before You Build
Diagnosis before delivery. This checklist surfaces the 3 to 5 structural failures blocking pipeline predictability and skips the cosmetic inefficiencies that distract from the real work. Run it internally, share the results with leadership, and prioritize by revenue impact. Fix the foundation (CRM hygiene, attribution architecture, MQL definition) before you scale the execution layer (automation, dashboards, paid-media budgets).
The diagnostic is free. Acting on what it surfaces is where the investment begins. Effiqs builds revenue engines teams own outright: CRM architecture, attribution systems, and revenue operations governance installed as permanent, client-owned assets, in fixed-scope systems that outlast the engagement.
Revenue operations isn't consulting theater. It's the operating architecture that decides whether your growth is repeatable or one-time luck. If you want a second set of eyes on your infrastructure audit results, Effiqs can help you read them.
- ✓ Audit six layers in order: CRM integrity, attribution, sales/marketing alignment, funnel logic, forecasting, and tech-stack integration. A failure in one cascades into the rest.
- ✓ Start with data hygiene. Attribution, forecasting, and pipeline reporting all depend on clean, governed CRM data.
- ✓ Most revenue problems are structural, not tactical. They live in handoffs, inherited stage defaults, and disconnected systems.
- ✓ Prioritize by revenue impact, and fix foundations like data, tracking, and MQL definitions before building automation or dashboards.
- ✓ Give every fix a single owner, and start with one two-week quick win to build momentum and budget support.
FAQ
What is a RevOps diagnostic audit?+
A RevOps diagnostic audit evaluates the structural health of your revenue engine across six layers: CRM data integrity, attribution and tracking, sales and marketing alignment, funnel conversion logic, forecasting and reporting, and tech-stack integration. It identifies the 3 to 5 failures blocking pipeline predictability and ranks them by revenue impact.
Which RevOps layer should B2B SaaS teams audit first?+
Start with CRM data integrity and hygiene. Attribution, forecasting, and pipeline reporting all depend on clean, governed data, so problems at this foundation layer distort every report and automation downstream.
How should I prioritize fixes after a RevOps audit?+
Use four rules: fix what affects pipeline accuracy, forecast reliability, or attribution integrity first; fix foundations before building automation; pick one two-week quick win for momentum; and assign a single owner to every issue, escalating cross-functional dependencies early.
Why does my attribution report disagree with my finance model?+
Common causes are inconsistent UTM naming, conversion events defined differently across analytics, CRM, and ad platforms, broken cross-domain tracking, and missing offline-conversion imports. A low analytics-to-CRM deal-match rate usually points to where the data is being lost.
Why do sales and marketing disagree about lead quality?+
The cause is usually a handoff problem: an MQL definition that isn't documented, agreed by both teams, or enforced in scoring and routing logic. Without a tracked handoff SLA, structured feedback on rejected leads, and shared KPIs, each team optimizes for a different definition of success.
Sources
- [1]Buying groups of 6 to 10 decision-makers in the B2B buying journey. Gartner, B2B Buying Journey.