Backgorund Asset - EffiqsBackgorund Hexagon Composition - EffiqsBackground Hexagon - EffiqsBackgorund Hexagon Composition - EffiqsBackgorund Hexagon Composition - EffiqsBackgorund Hexagon Composition - EffiqsBackgorund Hexagon Composition - Effiqs

Looker Studio Dashboards

Gain valuable insights from your business’ data.

Price Composition Dark - Effiqs
$500M+
Raised by our clients
Lead Composition - Effiqs
75+
Satisfied B2B Tech Clients
Time Composition - Effiqs
+15 years
Of Digital Marketing experience

Visualizing and analyzing data with Looker Studio

Is Looker a data studio? Yes, Looker Studio (Formerly Google Data Studio) is a business tool that allows you to make and share data visualizations and reports to make informed decisions. Here are a few examples of Looker Studio visualizations:

  • Dashboard: Shows how average order value (AOV), net profit, and value sales are connected.

  • Horizontal bar chart: Ideal to show the number of purchases by category.

  • Circular visualization: Use sections (like donut slices) to show your data series in a circular way.

  • Filled map: Use Google Maps to look at your geographic data as shaded areas.

Looker Studio can connect to more than 800 data sources without having to use software or code. It also has a web interface that is easy to use, Report templates, Data connectors, a Report editor with drag-and-drop objects, and a Snap-to-grid canvas.

The power of Looker Studio Dashboards

Looker Studio allows users to create interactive and customizable dashboards using a variety of data sources. Whether you're tracking website performance, marketing campaigns, or sales metrics, Google Data Studio Dashboards provide a comprehensive view of your data in a visually appealing format.

Benefits of Looker Studio for B2B tech companies

  • Customization: Tailor your dashboards to showcase the most relevant metrics for your business.

  • Real-time Data: Access up-to-date information to make timely decisions.

  • Interactive Visualizations: Engage with your data through interactive charts, graphs, and tables.

  • Collaboration: Share and collaborate on dashboards with team members and stakeholders.

How does Looker Studio work?

  • Data sources: Looker Studio integrates with a wide range of data sources, including Google Analytics, Google Sheets, Google Ads, BigQuery, and many more. You can connect to these data sources and import the relevant data into Data Studio.

  • Dashboard creation: Once you have connected your data sources, you can start creating your dashboard. Looker Studio provides a user-friendly interface where you can drag and drop various components such as charts, tables, and filters onto your canvas.

  • Visualization options: Looker Studio offers a variety of visualization options to present your data in a visually appealing manner. You can choose from different chart types, including bar charts, line charts, pie charts, and maps. Additionally, you can customize the colors, fonts, and styles to match your branding or personal preferences.

  • Data manipulation: Looker Studio allows you to manipulate your data to derive meaningful insights. You can apply filters, create calculated fields, and use functions to transform and analyze your data. This flexibility enables you to perform in-depth analysis and uncover trends and patterns.

  • Interactivity and collaboration: One of the key features of Looker Studio is its interactivity. You can add interactive elements such as date range controls, drop-down menus, and clickable links to navigate through your data. Moreover, you can share your dashboards with others, collaborate in real time, and control access permissions.

  • Real-time data updates: Looker Studio provides real-time data updates, ensuring that your dashboards always reflect the latest information. This is particularly useful for monitoring live data, tracking real-time metrics, and making timely decisions.

Looker Studio Dashboards with Effiqs

At Effiqs, we empower B2B businesses to gain valuable insights, make data-driven decisions, and communicate information effectively through visually appealing dashboards. This is our process:

Understanding your unique business needs and KPIs

Understanding Key Performance Indicators (KPIs) is crucial for businesses to measure their success. Different KPIs are beneficial for different kinds of businesses, as each company is unique and has different needs and goals. KPIs are specific, measurable, achievable, relevant, and time-bound metrics that organizations use to evaluate their performance.

Collecting and integrating data from multiple sources

This step is essential for  B2B tech businesses to gain a comprehensive view of their operations. By gathering data from various sources such as customer databases, sales records, website analytics, and social media platforms, businesses can obtain valuable insights and make informed decisions. Integrating data involves combining data from different sources into a unified format, allowing for easier analysis and reporting. This process may involve data cleansing, transformation, and consolidation to ensure data accuracy and consistency.

Designing and setting up your Looker Studio reports

When designing and setting up your reports, we consider the following:

  • Choose the most relevant metrics for your business and customize your reports to showcase them effectively.

  • Utilize the wide range of visualization options available in Data Studio, such as charts, graphs, and tables, to present your data in a visually appealing manner.

  • Take advantage of the collaboration features in Data Studio to share and collaborate on reports with team members and stakeholders.

  • Ensure that your reports are user-friendly and easy to navigate, allowing users to interact with the data and gain insights.

Continuous monitoring and optimization

The monitoring phase involves regularly tracking and analyzing your business performance to identify areas for improvement. By monitoring key metrics and performance indicators, you can identify trends, patterns, and opportunities. On the other hand, optimization involves making data-driven decisions to enhance your business processes, strategies, and outcomes. This may include adjusting marketing campaigns, refining product offerings, or improving operational efficiency based on the insights gained from data analysis.

Getting valuable data from Looker Dashboards with Effiqs

At Effiqs, we’ve used Looker Studio to simplify the process of visualizing and analyzing data for our B2B business clients, making it accessible to decision-makers with varying levels of technical expertise. It empowers businesses like yours to gain valuable insights, make data-driven decisions, and communicate information effectively through visually appealing dashboards. Do you want to be one of them? Schedule a free strategy call with our Looker Studioexpert and CEO, Alex Hollander. 

Our Technologies for

Looker Studio Dashboards

Google Data Structure

Why choose Effiqs?

GROWTH OPERATIONS FOR B2B TECH

Price Icon - Effiqs

BEST COST/BENEFIT ALTERNATIVE

NO RETAINERS OR HIDDEN FEES

Some of our
‍‍‍Success Cases

Improved Search Ranking and Successful Repositioning
Trusted Partner for Seamless Project Completion

Webflow
Success Cases

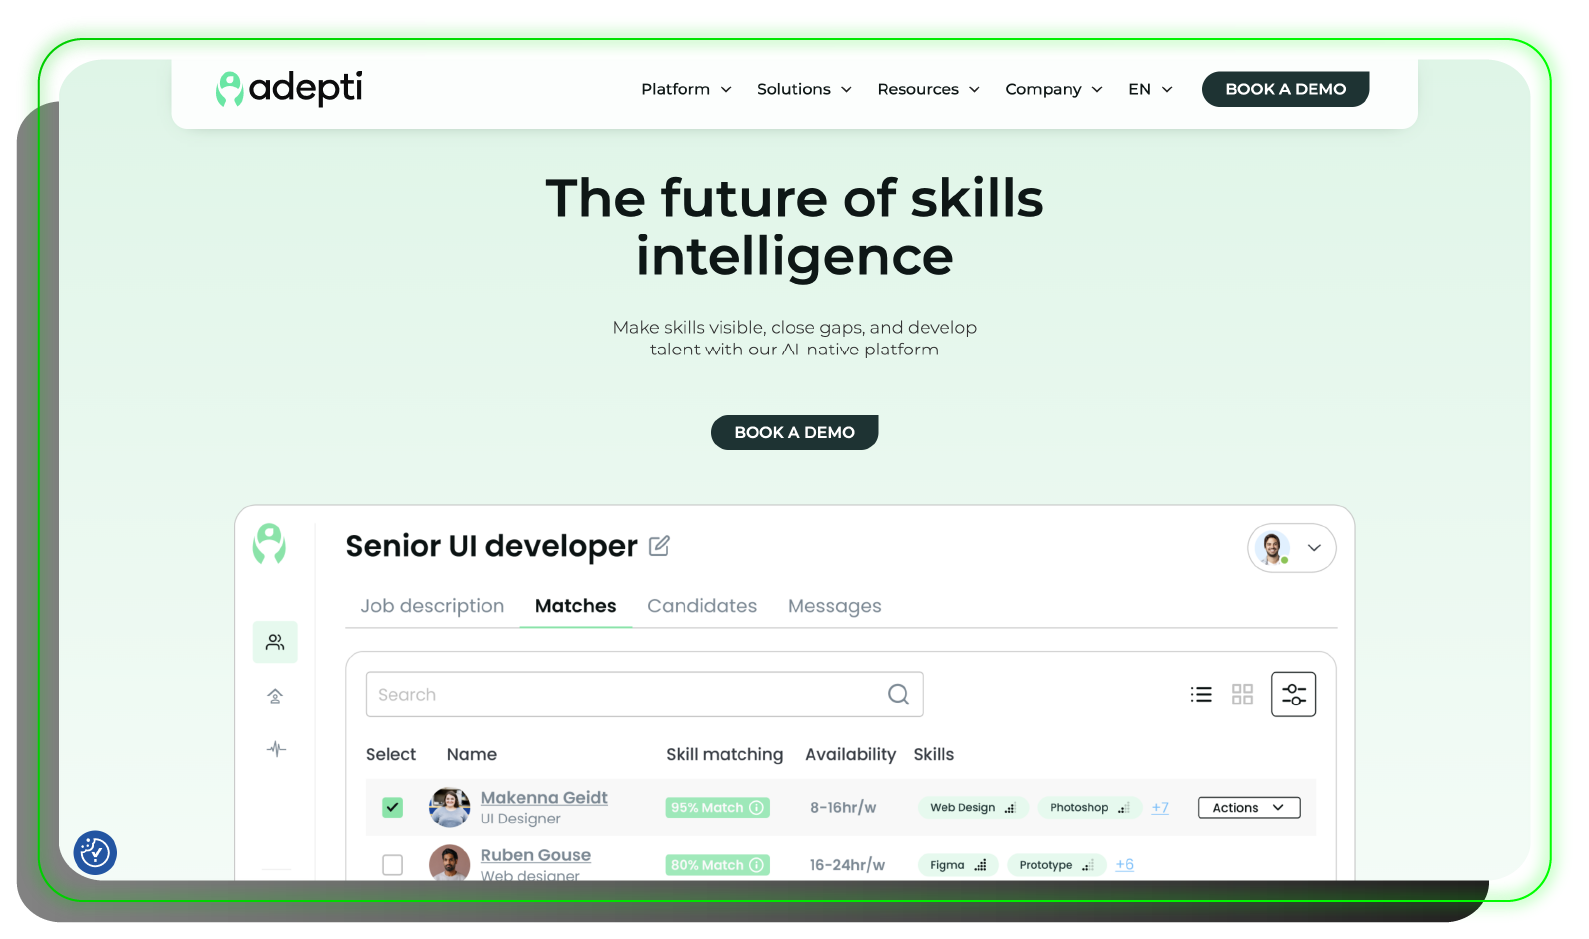
Adepti
SaaS Learning Matching
Visit Live Site →
Lytho
SaaS Creative Management
Visit Live Site →
Arena
SaaS Instant Messaging
Visit Live Site →
Compueducacion
SaaS Learning
Visit Live Site →

Our Clients Trust Our
Marketing Operations Expertise

Worqflow LogoWorqflow Logo

FAQs

Can I integrate Google Analytics with Looker Studio?

Yes, Looker Studio integrates seamlessly with Google Analytics, allowing you to import and visualize your website's analytics data in a user-friendly dashboard.

Can I create custom reports in Looker Studio?

Yes, Looker Studio allows you to create custom reports by selecting the relevant data sources, choosing visualization options, and applying filters and date ranges.

Can I automate data updates in Looker Studio?

Yes, you can set up scheduled data refreshes in Looker Studio to ensure that your dashboard always reflects the latest information.

Target Icon

Other

Attribution

Services

We are a B2B SaaS & Tech Growth Operations Agency that offers comprehensive, data-driven solutions in a variety of service categories.

SEE ALL SERVICES
Background Hexagon - EffiqsBackgorund Asset - Effiqs
Alex Hollander B2B SaaS Marketing Specialist

Ready to be our next success case?